
Published Posters
Ultrastructural Characterization of Resin Embedded Biological Samples Using STEM-HAADF Mode
Bernd Zechmann1,*
1Center for Microscopy and Imaging, Baylor University, Waco, TX, USA
*Corresponding author: [email protected]
For ultrastructural investigations resin embedded biological samples are most commonly imaged in TEM brightfield mode. In this mode the electron beam transmits through the sample. Non-scattered electrons that transmit through the sample and strike the camera appear bright whereas electrons that are reflected or absorbed by the sample and scattered electrons that don’t strike the camera appear black. The ultrastructure of the samples appears black and white on the final TEM brightfield image. Advanced TEMs can also be operated in scanning transmission electron microscopy (STEM) mode where the electron beam is much smaller and scans across the surface of the sample. For imaging purposes electrons that scatter at high angles can be detected with the high-angle annular dark field (HAADF) detector. The intensity of scattered electrons is directly proportional to the atomic num-ber of the atoms in the samples. Thus, in the final image elements with high atomic mass appear brighter than elements with low atomic mass which appear darker. Ultrastructural investigations of resin embedded biological samples in STEM-HAADF mode are rare. In this study STEM-HAADF mode was used to image sections of resin embedded biological samples that did not receive post contrasting. The hypothesis was tested that image contrast and quality would be better in STEM-HAADF mode when com-pared to TEM brightfield mode. Different biological samples (algae cells, plant leaves, mouse brain and liver tissue) were prepared for TEM analysis by fixing them in 2.5% of glutaraldehyde followed by 1% osmium tetroxide in phosphate buffer. Samples were then rinsed in buffer, dehydrated in a series of acetone (50%, 70%, 90%, and 100%), infiltrated with EMBed812 epoxy resin and polymerized for 48h [1]. Resin blocks were trimmed (EM-TRIM, Leica Microsystems) and ultra-thin sections (80 nm) were sectioned with an EM UC7 ultramicrotome (Leica Microsystems). Sections were not treated with post-contrasting agents but directly imaged in STEMHAADF or TEM brightfield mode with a Spectra 300C TEM (Thermo Fisher Scientific, Hillsboro, OR). For the final im-age in STEM-HAADF mode 300KeV with a convergence angle of 10.3 mrad, a camera length of 87 mm, and a collection angle range between 66 – 200 mrad were used. For STEM-HAADF images, resolution was set to 2048x2048 and dwell time to 10 μs (Fig. 1a). Images taken in STEM-HAADF mode were inverted (Fig. 1b) to make them appear like images taken in traditional bright field TEM mode (Fig. 1c). For TEM brightfield images a series of 10 images (exposure time 1 second each) were taken with a Ceta D camera (Thermo Fisher Scientific, Hillsboro, OR) and were overlaid to one image (Fig. 1c). STEM-HAADF mode yielded better image quality in terms of contrast, brightness, signal-to-noise ratio, and perceived image quality of sections that were not post-contrasted (Fig. 1b, 2a-d) when compared to TEM brightfield images (Fig 1c). Image analysis confirmed that, when compared to brightfield TEM mode, all of these parameters scored higher in STEM-HAADF mode (data not shown). Organelles such as chloroplasts, mitochondria, nuclei, vacuoles were clearly visible in STEM-HAADF mode (Fig. 2). Even fine ultrastructural features such as thylakoids of chloroplasts (Fig. 2b), cristae in mitochondria (Fig. 1b, 2c), and ribosomes on rough endoplasmic reticulum were well visible (Fig. 2c). In summary, STEM-HAADF mode was well suited to image sections of biological samples that did not receive post contrasting such as algae, plant leaves, mouse brain and liver. Additionally, image analysis confirmed that images taken in STEM-HAADF mode yielded better image quality than images taken in TEM-brightfield mode.
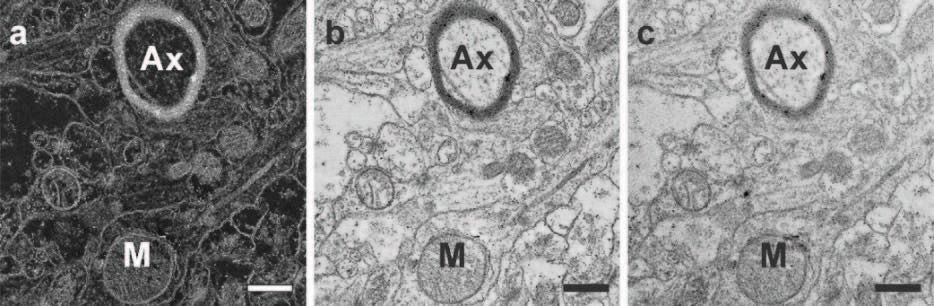
Figure 1. Micrographs of a mouse brain cell taken in STEM-HAADF mode (a, b) and TEM brightfield mode (c). In images taken in STEM-HAADF mode (a) structures with high atomic mass appear bright and structures with low atomic mass appear darker. The inverted STEM-HAADF image (b) yielded slightly better image quality than the image taken in TEM brightfield mode (c). Ax=Axon, M=Mitochondrion. Bars=0.5nm.
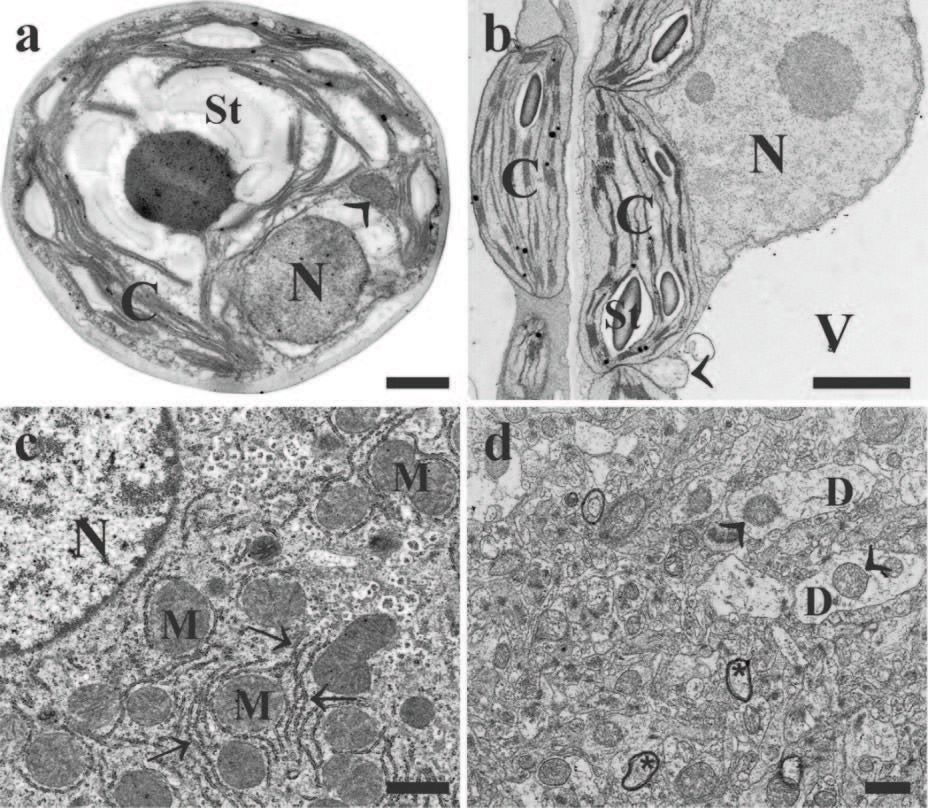
Figure 2. Inverted STEM-HAADF micrographs of a) Chlorella sorokiniana with a large chloroplast (C) containing starch (St), a mitochondrion (arrowhead), and a nucleus (N), b) leaf section of Nicotiana tabacum with several chloroplasts (C), a mitochondrion (arrowhead), a large nucleus (N), and a vacuole (V), c) mouse liver cell with several mitochondria (M), a nucleus (N), and a well-defined network of rough endoplasmic reticulum (arrows), and d) mouse brain cell with axons (asterisks), dendrites (D), and mitochondria (arrowheads). Bars=1μm.
Reference
- Haberman KL et al. Microsc Microanal (2025) 31 ozaf038. https://doi.org/10.1093/mam/ozaf038.
Signal Enhancement via Stage Biasing in Biological Specimen Imaging by Scanning Electron Microscopy
Nathalie Becerra-Mora1,* , Sarah LaGrange1, , Danielle Little2 , Michael Dyer2, Hanane Khoury3Mac Williamson3,Wilson Clements3, and Camenzind G Robinson1
1Cell and Tissue Imaging Center- Electron Microscopy, St Jude Children’s Research Hospital, Memphis, TN, USA
2Developmental Neurobiology Department, St Jude Children’s Research Hospital, Memphis, TN, USA
Hematology Department, St Jude Children’s Research Hospital, Memphis, TN, USA*Corresponding author: [email protected]
Living organisms are highly organized three-dimensional structures. Organs and tissues, which are meticulously assembled, are composed of millions of cells and specialized tissues anchored and bound together by macromolecules. Electron microscopy (EM) has enabled deeper examination of minute details at the cellular and subcellular level; more recent breakthroughs in EM made it possible to examine the organization of living organisms at the molecular level. The continued development of electron micros-copy has allowed observation of the architecture and interaction of individual cells and tissues across scales [1]. Volume electron microscopy (vEM), established as the leading technique to elucidate the complex three-dimensional frame-work of living organisms, has evolved to the point where electrons can be used to image across several scales: ranging from the imaging of cellular membranes to the localization and tracking of cells, cell to cell interactions, organelle configurations, em-bryonic development, and cell migration. Also, major breakthroughs in the field of connectomics have allowed the localization and segmentation of neurons in small brains [2-4]. While vEM possesses merits such as high spatial and volumetric resolution, throughput is a constraint that limits its use or puts a high price tag on it. As high resolution imaging requires longer dwell time per pixel, scanning times become burdensome as the time required scales as the square of the increase in resolution. Imaging times can be reduced by the reduction of pixel dwell times and/or the collection of lower resolution data. Either of these strategies can result in the loss of valuable information through an insufficient signal to noise ratio (SNR) or the inability to resolve small details. Alternatively, sample preparation that maximizes the amount of heavy metal incorporated into the sample can be utilized as higher metal content results in an increased SNR, however, this can also result in the occlusion of small details by metal accretion within the sample. By applying a negative bias to the sample stage, two phenomena take place. First, because the effective imaging energies are a result of the accelerating voltage minus the stage bias, a higher accelerating voltage can be employed while retaining the smaller interaction volume of a low accelerating voltage and benefiting from the robustness of the larger accelerating voltage. Secondly, for electrons excited by the primary beam, the field created by the stage bias increases their take-off angle and accelerates them, enhancing the number and energy of electrons detected. For insertable backscatter electron detectors (BSED), often single or multi-sector diode detectors, this is advantageous as increased electron energy leads to better detector efficiency and SNR. The use of stage biasing on a Zeiss SEM is known as Tandem decel (TD). We describe the use of TD to optimize and accelerate low kV image acquisition. Danio rerio were processed via two protocols that encompass the use of tannic acid as mordant; the protocol as previously published in [5] has a two-step reduced osmium tetroxide-osmium tetroxide contrasting that in our experience aided in acquiring images with high SNR for collagen and extra-cellular matrix components at 3nm/pixel resolution and 3.2 µs dwell time as seen in Figure 1. A second sample was processed with an alternative in-house protocol, in which there is only one osmium tetroxide step. Figure 2 shows that high-resolution imaging at low acceleration voltages can be acquired with the aid of TD; dwell times can be decreased from 25.6 µs in non-biased and non-decelerated imaging to 6.4 µs when the bias was set to 3.0 kV. TD, employed on a sample prepared with a single osmium step, provided contrast and speed enhancements equivalent or better than a double osmium step protocol. Retina from Mus musculus was imaged to demonstrate the capability of TD to enhance image acquisition throughput, in speci-mens prepared with single steps of reduced osmium and uranyl acetate, resulting in lower metal loading than typically required for BSED imaging. Figure 3a shows a 307 x 30 µm mosaic acquired over a span of 50 minutes at a 3nm/pixel resolution, dwell 3.2 µs, acceleration voltage of 2.0 kV and the stage bias of 1.0 kV resulting in a landing energy (LE) of 1.0 kV. Double membranes and periodicity of collagen fibrils were resolved as shown in Figure 3 b and c. With the purpose of reducing acquisition time while maintaining quality of the images, the acceleration voltage was elevated to 4.2 kV while adjusting the stage bias to 1.2 kV, boost-ing backscattered electron generation without oversampling the substrate. Images collected at a 3nm/pixel and 1.6 µs dwell show that sample biasing improves BSE generation and collection, enabling high-SNR imaging in shorter acquisition times. TD here provides enabling technology for large scale acquisitions of samples with lower metal contents.TD (stage biasing) provides en-hanced acquisition speed and contrast to at least the equivalent of multi-step osmium protocols and/ or the inclusion of other stain-ing compounds. In our hands, TD provide technical flexibility in dealing with specimens originally prepared for transmission electron microscopy as well as samples purpose prepared for large area or array tomography imaging [6].
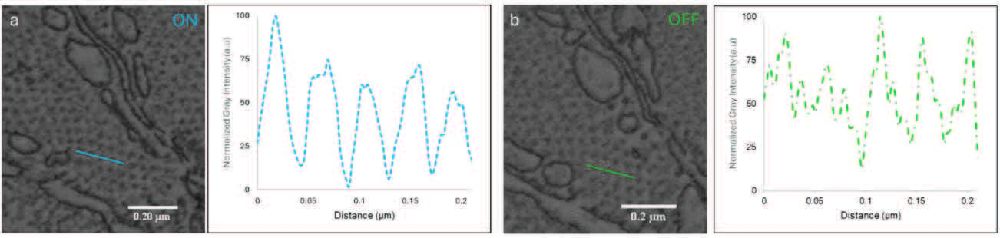
Figure 1. BSED images and line profiles of collagen tubules in D. rerio acquired with TD on a single osmium step preparation (a), and TD off imaging of a double osmium step preparation(b). Acceleration voltage and dwell time settings a, EHT = 4.2 kV, bias = 3.0 kV, dwell = 3.2 µs, b, EHT = 4.2 kV, bias =0 kV, dwell= 3.2 µs.
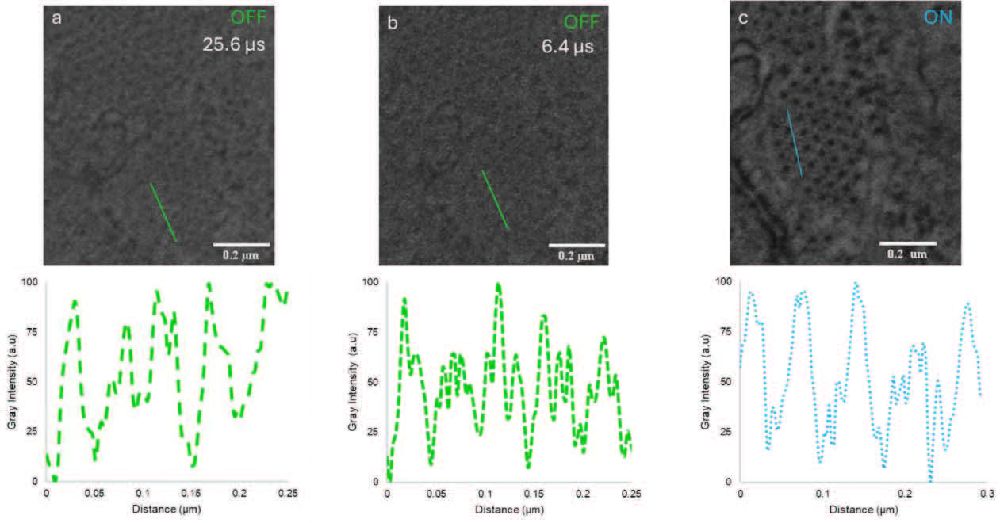
Figure 2. SED images and line profiles of collagen tubules in single osmium step preparations of D. rerio with TD off (a and b), and TD on (c). Acceleration voltage and dwell time settings a. EHT= 3.0 kV, bias =0 kV dwell= 25.6 µs, b. EHT=3.0 kV, bias =0 kV, dwell= 6.4 µs, c, EHT= 4.2 kV, bias= 3.0 kV, dwell= 6.4 µs.
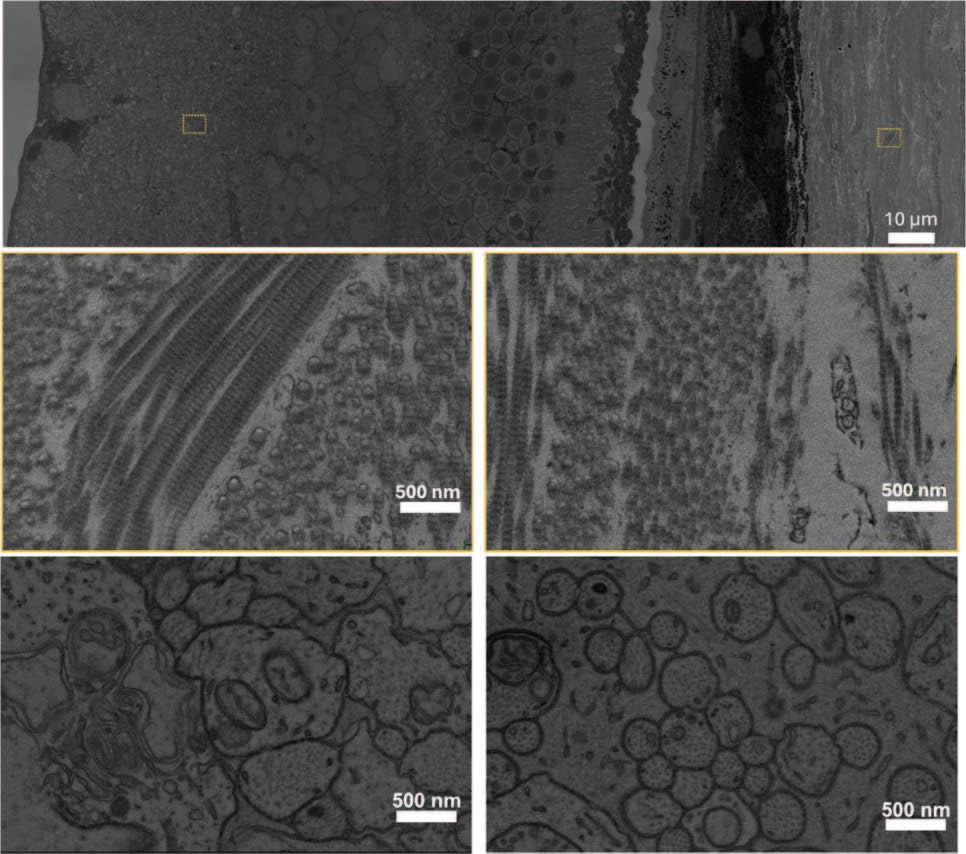
Figure 3. BSED images of M. musculus retina acquired using TD. a, b and c. EHT= 2.0 kV, bias= 1.0 kV dwell= 3.2 µs, d and e. EHT=4.2 kV, bias= 3.0 kV, dwell= 1.6 µs.
References
- Shapson-Coe A et al. Science (2024) 384 eadk4858. https://doi.org/10.1126/science.adk4858
- Smith S. BMC Biology (2018) 16 98. https://doi.org/10.1186/s12915-018-0560-1
- White IJ and Burden JJ. Methods in Cell Biology</em (2023) 9 171-196. https://doi.org/10.1016/bs.mcb.2022.12.023
- Svara F et al. Nature Methods (2022) 19 1357-1366. https://doi.org/10.1038/s41592-022-01621-0
- Starborg T et al. Nature Protocols (2013) 8 1433-1448. https://doi.org/10.1038/nprot.2013.086
- The authors acknowledge funding from St Jude Children’s Research Hospital and NCI P30 CA021765 to the Cell and Tissue Imaging Center..
Ultrastructural and Immunogold Electron Microscopy Characterization of Chloroquine-Induced Inclusion Body Myositis–Like Pathology in Skeletal Muscle
Hang Yeon Jeong1,* , Ye Sol Hano1,* , Eunyoung Moon1 , Seohyeong Lee1, Ju Yeon Lee2,3Ju Hwan Song2,4, Hang Yeon Jeong1, Ga-Young Choi1,, Hee-Seok Kweon1, and Yang Hoon Huh1,*
1Electron Microscopy Shared Resource, HHMI Janelia Research Campus, Ashburn, VA, United States
2Cryo-Electron Microscopy Shared Resource, HHMI Janelia Research Campus, Ashburn, VA, United States
*Corresponding author: [email protected]
#These authors contributed equally to this work.
Inclusion body myositis (IBM) is a progressive muscle disease characterized by chronic inflammation, impaired autophagy, and pathological protein aggregation, yet its ultrastructural mechanisms remain incompletely understood due to limited experimental models [1,2]. Here, we employed confocal microscopy, transmission electron microscopy (TEM), and immunogold labeling to characterize IBM-like pathology induced by chloroquine (CQ) [3] in skeletal muscle models. In vitro, differentiated C2C12 myotubes treated with CQ exhibited impaired myogenic differentiation and increased oxidative stress, accompanied by marked accumulation of amyloid precursor protein (APP) and protein aggregates [4]. Confocal imaging demonstrated spatial overlap between APP and ProteoStat-labeled aggregates, while TEM revealed enlarged autophagosomes, multilamellar bodies, and disrupted organelle architecture. Immunogold TEM further confirmed APP localization within CQinduced autophagic structures, indicating defective autophagic clearance and aberrant sequestration of amyloidogenic proteins. In vivo, chronic CQ administration produced pronounced ultrastructural abnormalities in mouse skeletal muscle, including mitochondrial enlargement and increased autophagic vacuoles in quadriceps and soleus muscles. Immunogold labeling revealed enhanced subcellular accumulation of the IBM-associated marker NT5C1A [5] within intermyofibrillar and subsarcolemmal regions. In contrast, liver tissue from the same animals showed preserved mitochondrial morphology and minimal autophagic alteration, indicating tissue-selective vulnerability. Complementary proteomic analysis demonstrated broad dysregulation of mitochondrial and protein quality control pathways, consistent with the observed ultrastructural pathology. Together, these find-ings highlight the utility of high-resolution electron microscopy and immunogold approaches for visualizing autophagic disrup-tion and protein aggregation underlying IBM-like muscle pathology [6].
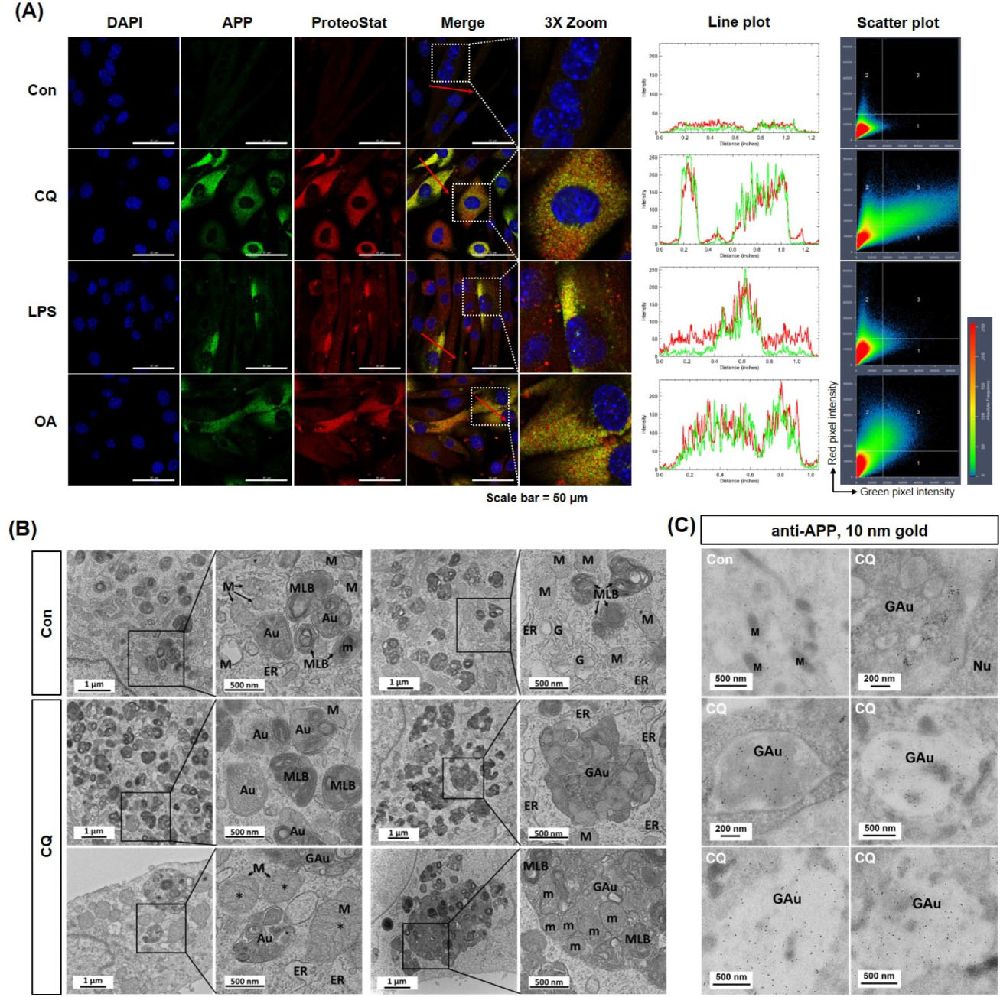
Figure 1. CQ treatment increased the accumulation of giant autophagosomes in C2C12 myotubes, leading to an increase in amyloid precursor protein. (A) Confocal microscopy images showing APP (green) and protein aggregates labeled with ProteoStat (red). Nuclei were counterstained with DAPI (blue). Merged and magnified images, line plots, and scatter plots illustrate colocalization between APP and ProteoStat signals. Scale bar = 50 μm. (B) Representative TEM images of control and CQ-treated myoblasts showing increased autophagosomes (Au), multilamellar bodies (MLB), and dilated endoplasmic reticulum (ER) in CQ-treated cells, compared with organized mitochondria (M) and ER in controls. Scale bars = 1 μm and 500 nm. (C) Immunogold TEM with anti-APP antibody (10 nm gold particles), showing APP localization within CQ-induced autophagic structures (GAu). M, mitochondria; Nu, nucleus. Scale bars = 200–500 nm.
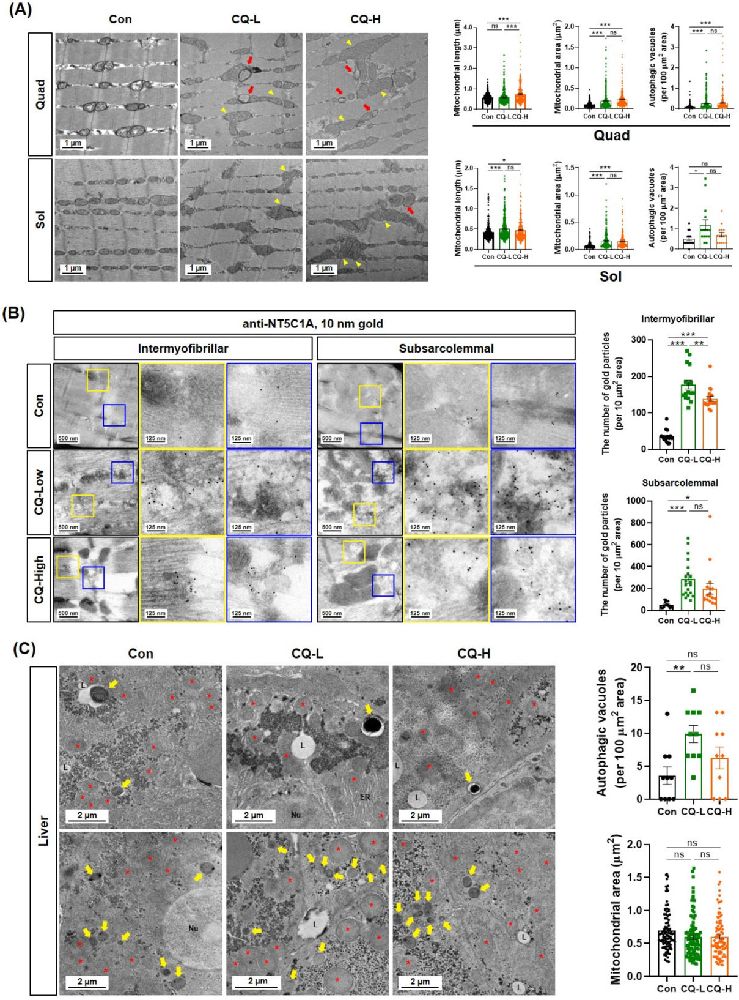
Figure 2. Chronic CQ administration induces IBM-like pathological changes in mouse skeletal muscle without affecting the liver. (A) Representative TEM images of Quad and Sol muscles from Con, CQ-L, and CQ-H mice. Yellow arrowheads indicate abnormal mitochondria, and red arrows indicate autophagic vacuoles. Quantitative analysis of mitochondrial length, area, and autophagic vacuole density is shown on the right. Scale bars = 1 μm. (B) Immunogold TEM images of Quad muscles labeled with anti-NT5C1A antibody. Gold particles indicate NT5C1A localization in intermyofibrillar and subsarcolemmal regions. Quantification of NT5C1A-positive gold particle density is shown on the right. Scale bars = 500 nm (overview) and 125 nm (zoomed images). (C) Representative TEM images of liver tissue from Con, CQ-L, and CQ-H mice. Yellow arrows indicate autophagic vacuoles, and red asterisks mark mitochondria. Quantitative analysis of autophagic vacuole density (upper) and mitochondrial area (lower) is shown on the right. L, lipid droplet; Nu, nucleus; ER, endoplasmic reticulum. Scale bars = 2 μm. Data are presented as mean ± SEM. *p < 0.05, **p < 0.01, ns, not significant.
References
- Naddaf E. Front Neurol (2022) 13 1020113.
- Skolka MP and Naddaf E. Curr Opin Rheumatol (2023) 35 404–413.
- Mauthe M et al. Autophagy (2018) 14 1435–1455.
- Boncompagni S et al. J Biol Chem (2012) 287 20534–20544.
- Ikenaga C et al. Ann Clin Transl Neurol (2021) 8 571–578.
- This research was funded by Korea Basic Research Institute (KBSI) Grant (C623200).
Cryo-electron Microscopy of Vitreous Sections (CEMOVIS) Application for Model Organisms
Kunihiro Uryu1,* , Xiaowei Zhao2 , Momoko Shiozaki2 , and Zhiheng Yu1,2
1Electron Microscopy Shared Resource, HHMI Janelia Research Campus, Ashburn, VA, United States
2Cryo-Electron Microscopy Shared Resource, HHMI Janelia Research Campus, Ashburn, VA, United States
*Corresponding author
Cryo-ultramicrotomy, developed by Bernhard in 1965 [1], has long been regarded as the pinnacle of achievement for electron microscopists. This technique allows biological samples to be sliced into ultrathin sections and examined in a cryo-electron micro-scope, revealing the most intricate subcellular structures without chemical fixation or staining. The advent of vitrification [2,3] and high-pressure freezing (HPF) technology [4,5] provided reliable methods for preserving cellular structures, and the introduc-tion of diamond knife to cryo-ultramicrotomy [6] offering cryo-ultramicrotomists reassurance in consistency of the quality [7]. On one hand, advancements in HPF systems, the precision of electron microscopes, and digital imaging technology have sig-nificantly enhanced cryo-EM imaging capabilities. On the other hand, continuous improvements in ultramicrotome technology and their supporting environments have further optimized the technique. These enhancements include precise control of cutting temperatures, the use of ionized nitrogen to neutralize electron charging, and the development of tools such as diamond knives, the lash/EM grid manipulator, and a specialized voltage charging function to press sections onto EM grids [8]. Despite recent advancements, the contribution of cryo-electron microscopy of vitreous sections (CEMOVIS) in the field remains suboptimal. It is believed that the method remains technically challenging (e.g., the yield of high-quality micrographs is low) and cutting artifacts often deter researchers from further pursuing the technique [9].
In our efforts to overcome these challenges, we revisited and refined the method through a series of experiments. One of the focuses was on applying this technique to model organisms such as C. elegans, Drosophila, and mouse biopsy tissues. These tis-sues were subjected to high-pressure freezing followed by cryo-ultramicrotomy at temperatures ranging from -146°C to -160°C. Cutting conditions were tested between 50 and 200 nm section thicknesses with 50 to 200 um sample size. The ultramicrotome environment was optimized by reducing humidity and introducing remedies to reduce statistic charging. To address the retention of tissue integrity posed by animal models with cuticles and wax coverings, we tested various cryoprotectants, including bovine serum albumin, dextran, 1-hexadecene, sodium alginate, or specially formulated cryoprotectant cocktails with and without de-tergents. Our work is ongoing, but we are pleased to share the progress we’ve made [10].
Image ozaf048484
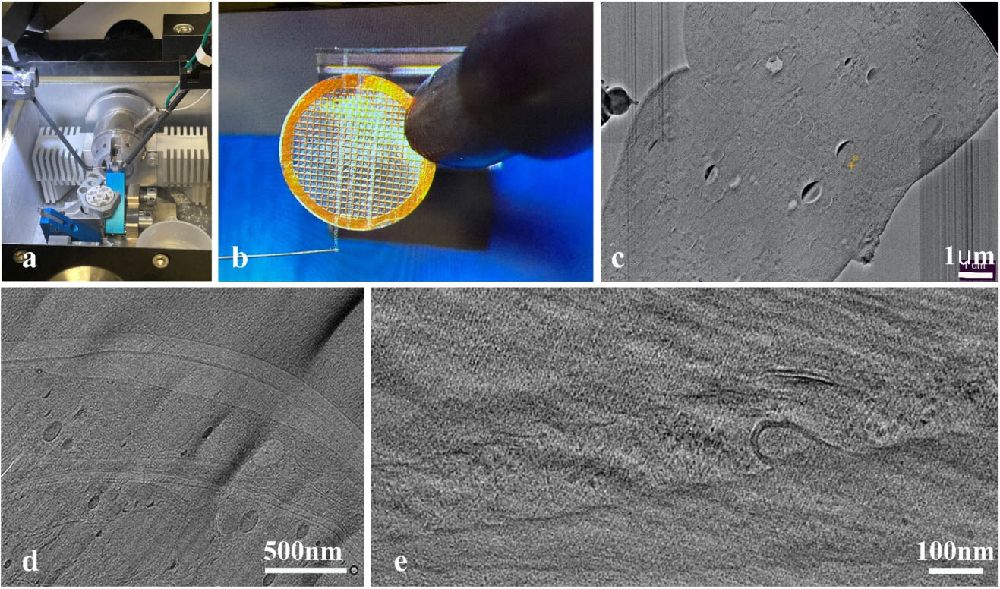
Figure 1. a) Cryo-microtome chamber with a lash and grid holder. Extra groundings were applied to reduce electron charging. b) A gold grid was used to collect ribbons of cryo-sections. Voltage charge increased the chance of retention of section in an organized manner. c,d,e) CEMOVIS sections from C elegans. A low magnification view of cross section (c), An intermediate magnification view of peripheral of the worm showing its preservation of the cuticle (d). A high-magnification view of a membrane structure, containing a fusing membrane vesicle, and electron dense granules (e).
Reference
- Bernhard W. Année biol. (1965) 4, 5-19. PMID: 14303978
- McDowall AW et al. Journal of Microscopy (1983) 131, 1–9. https://doi.org/10.1111/j.1365-2818.1983.tb04225.x
- Dubochet J et al. Q. Rev. Biophys. (1988) 21, 129-228. DOI: 10.1017/s0033583500004297
- Moor H in Cryotechniques in biological electron microscopy, Steinbrecht RA and Zierold K (Eds.), Berlin, Heidelberg: Springer; 1987. DOI:10. 1007/978-3-642-72815-0_8
- Studer D et al. Scanning Microsc. Suppl. (1989) 3, 253-68. PMID: 2694271
- Michel M et al. Journal of Microscopy (1992) 166, 43-56. https://doi.org/10.1111/j.1365-2818.1992.tb01506.x
- Al-Amoudi A et al. J. Struct. Biol. (2004) 148, 131-135. https://doi.org/10.1016/j.jsb.2004.03.010
- Studer D et al. Journal of Structural Biology (2014) 185, 125-128. https://doi.org/10.1016/j.jsb.2013.11.005
- Caspy I et al. Q. Rev. Biophys. (2025) 58, e6. DOI: https://doi.org/10.1017/S0033583525000010
- The authors acknowledge the funding from the HHMI support this study. We thank collegues from Janelia Research campus, esecially Drs. E Kuger and R Ikegami for scientific discussions and Mr. H Gnäegi in Diatome for technical support.
Time-Snapshot Volume Electron Microscopy Analysis of RNA Virus Replication Complex Assembly
Hong Zhan1,2,* , Adam Jochem1,2 , Mark Horswill1,2 , Johan den Boon1,2 , Pierre Gillotay3,4 , Kenneth Poss3,4 , and Paul Ahlquist1,2,5,*
1Rowe Center for Virology, Morgridge Institute for Research, Madison, WI, USA
2Institute for Molecular Virology, University of Wisconsin-Madison, Madison, WI, USA
3Department of Cell and Regenerative Biology, University of Wisconsin-Madison, Madison, WI, USA
4Morgridge Institute for Research, Madison, WI, USA
5McArdle Laboratory for Cancer Research, University of Wisconsin-Madison, Madison, WI, USA
*Corresponding author: [email protected], [email protected]
Recent advances in imaging technologies, from super-resolution light microscopy to volume electron microscopy (EM), have greatly expanded our ability to visualize the architecture of cells at multiple scales [1-5] . These methods now permit the study of structures ranging from individual proteins to entire cells or tissues, offering detailed insights into subcellular organization. Each approach faces challenges that can limit one or more aspects of cellular organization. Light microscopy can localize fluo-rescently tagged molecules but lacks ultrastructural resolution; conventional EM provides high-resolution details of subcellular ultrastructures but has limited scalability for capturing whole-cell volumes at nanometer resolution. Furthermore, chemical fix-ation can introduce artifacts, including morphological distortions.
A 3D EM technique, known as Volume EM, has emerged as a powerful tool for investigating cellular and tissue architecture at high resolution. In this approach, plastic-embedded sections are mounted on coverslips or grids and imaged by scanning electron microscopy (SEM) to build high-resolution, large-scale 3D datasets. In addition, the use of “epitope-friendly” plastic embedding materials, such as Lowicryl HM20 and LR White, permits immunolabeling of sections on glass coverslips. This workflow can be combined with correlative light and electron microscopy, often termed array tomography, to investigate specific proteins within their subcellular context [6-11].
Positive-strand [(+)] RNA viruses rearrange intracellular membranes to create virus-induced compartments or spherules, which serve as hubs for genome replication and virion assembly. These replication complexes undergo dynamic changes over the course of infection, involving interactions with host proteins and organelles essential for virus replication and survival. However, con-ventional transmission electron microscopy (TEM) captures only a thin slice of the cell, making it difficult to reconstruct the full organization of these replication complexes. To address these limitations, we focus on Flock House virus (FHV), a nodavirus that infects Drosophila S2 cells, as a tractable model for RNA virus replication. Our previous results using classical thin-section TEM showed that protein A clusters mitochondria and induces membrane invagination [12,13], but only partial snapshots of the cell during infection were obtained, limiting our understanding of how these replication complexes assemble, expand, and interact with other cellular components throughout the infection cycle.
To overcome these limitations, we developed a Time-Snapshot Volume EM approach. In this method, Drosophila S2 cells are infected with FHV and sampled at multiple time points (e.g., 4 hours, 8 hours, and 17 hours post-infection) via high-pressure freezing (HPF). HPF can rapidly vitrify cells without ice crystal formation, preserving ultrastructural details in a near-native state. The resulting resin-embedded blocks are then sectioned into large consecutive series of thin sections, which can be collected onto coverslips for array tomography (see Figure 1). At each infection time point, large-area SEM images of these sections are recorded to build a complete volumetric reconstruction of infected S2 cells (see Figure 2). This approach allows us to track changes in mito-chondrial localization, the distribution of replication spherules, and any additional membrane rearrangements throughout the cell.
For more precise molecular identification, we will further perform immunofluorescent labeling on the same serial sections. We will target both FHV proteins, including the replicase protein A, the capsid protein, and the protein B1/B2 and host proteins, in-cluding mitochondrial membrane proteins. By overlaying fluorescence signals on the electron micrographs, we can correlate the two datasets to investigate how these viral factors localize relative to each other and to host proteins and organelles.
By comparing early and late time points, we aim to investigate how the localization of mitochondria is controlled during in-fection and how virus-host interactions change when virion assembly begins. Beyond FHV, the workflow described here can be extended to the study of other (+)RNA viruses, such as alphaviruses and flaviviruses, which shares similarities in host mem-brane remodeling for their genome replication.
In conclusion, Time-Snapshot Volume EM offers a powerful combination of high-resolution volumetric imaging and molecular specificity, enabling detailed visualization of the formation and progression of virus-induced replication compartments. By coup-ling HPF with large-scale array tomography reconstructions, we can investigate the spatial and temporal dynamics of replication complexes within entire infected cells.
Image ozaf048.382 figure 1
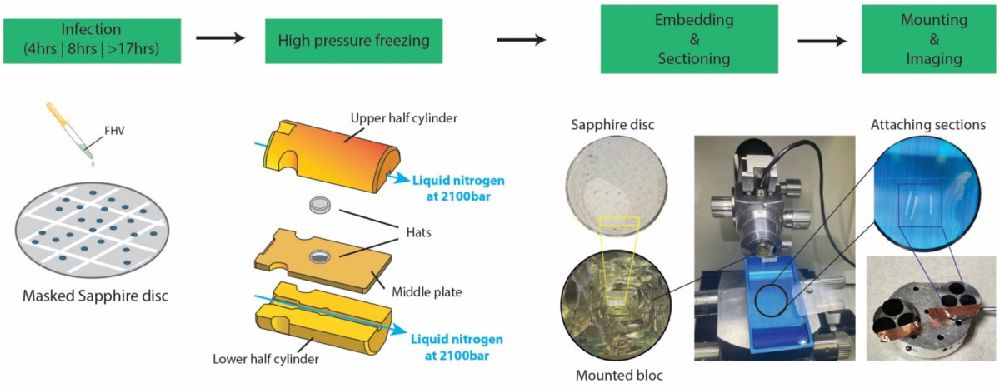
Fig. 1. Workflow for Volume EM analysis of FHV-infected S2 cells. S2 cells infected with FHV were seeded on carbon-coated sapphire discs and high-pressure frozen at multiple time points (4, 8, and >17 hours post-infection). Samples were then embedded in HM20 resin using an automatic freeze-substitution system. Ultrathin sections (120 nm) were cut with a Diatome Jumbo knife and collected on coverslips. Finally, images were acquired with a Zeiss Gemini 450 SEM.
Image ozaf048382 - figure 2
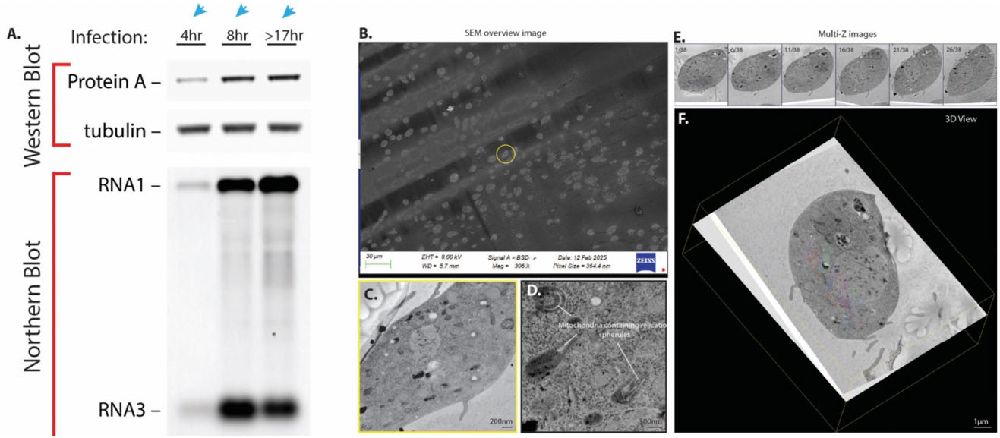
Fig. 2. 3D large-volume EM analysis of FHV-infected S2 cells at 4hr, 8hr, and >17hr post-infection. (A) Western blot showing FHV protein A expression levels and Northern blot detecting FHV genomic RNA1 and RNA3 across the three time points. (B) Overview of serial sections imaged by SEM. (C) SEM image (backscatter detector) of a 4hr-infected S2 cell. (D) High-magnification image revealing mitochondria-associated replication spherules in a 4hr-infected S2 cell. Scale bars = 200nm (left) and 500nm (right). (E) Multiple Z-planes from the serial-section dataset of a 4hr-infected S2 cell. (F) 3D reconstruction and mitochondrial segmentation of an intact 4hr-infected S2 cell. Scale bar = 1µm.
References
- Gustafsson MGL. Proceedings of the National Academy of Sciences. (2005) 102 13081–13086
- Betzig E et al. Science (2006) 313 1642–1645.
- Rust MJ et al. Nature Methods (2006) 3 793–796.
- Hein B et al. Proceedings of the National Academy of Sciences of the United States of America (2008) 105 14271–14276
- Schlegel P et al., Nature (2024) 634 139–152.
- Micheva KD and Smith SJ. Neuron (2007) 55 25–36.
- K. D. Micheva, N. O’Rourke, B. Busse, S. J. Smith, Cold Spring Harbor Protocols, in press, doi:10.1101/pdb.top89.
- Micheva KD et al. Cold Spring Harbor Protocols, in press. doi:10.1101/pdb.prot5525.
- Micheva KD et al. Cold Spring Harbor Protocols, in press, doi:10.1101/pdb.prot5524.
- Micheva KD et al. Cold Spring Harbor Protocols, in press, doi:10.1101/pdb.prot5526.
- Micheva KD and Bruchez MP. Current Opinion in Neurobiology (2012) 22 94–100.
- Kopek BG et al. Journal of Virology (2010) 84 12492–12503.
- Kopek BG et al. PLoS Biology (2007) 5 e220.
DMP-10 as Accelerators in Epoxy Resin Embedding for TEM Sample Preparation
Han Chen1,*
1TEM Core Facility, Department of Research Resource, The Pennsylvania State University, College of Medicine, Hershey, PA, USA
*Corresponding author: [email protected]
Effective TEM embedding requires uniform resin composition, good solubility, low viscosity, minimal shrinkage, beam stability, and excellent sectioning. However, achieving all these properties is challenging. Lower-viscosity resins often shrink significantly during polymerization, affecting sample integrity.
Since their introduction in 1956, epoxide resins have been widely used in TEM. Araldites offer superior sectioning but are high-ly viscous, while Epon 812 [1] improved handling with lower viscosity. Spurr resin [2] became popular for its penetration prop-erties, though it is less effective in aqueous uranyl acetate staining and has safety concerns.
Accelerators are essential for epoxy polymerization. DMP-30 and BDMA efficiently polymerize Araldite and Epon resins [3]. DMP-10, a dimethylaminomethyl phenol blend, increases viscosity and slows polymerization at room temperature, allowing bet-ter control. Its steric hindrance delays curing at lower temperatures, making it ideal for delicate biological samples.
This study utilized LX112 resin (Ladd Research) with DMP-10 (Tousimis) to embed mouse liver, heart, and skeletal muscle. Thin sections (70 nm) were cut with a Diatome 350 Ultra diamond knife on a Leica UC7 ultramicrotome, stained with uranyl acetate and lead citrate, and imaged using a JEOL JEM1400 TEM at Penn State College of Medicine TEM Facility (RRID: SCR_021200). The NANOSPRINT43M-MARKII camera (AMT) captured high-resolution images, revealing intact nuclear membranes, mitochondria with distinct cristae, and well-preserved cellular morphology with minimal distortion.
Our findings suggest LX112 resin with DMP-10 is a viable alternative to Spurr resin for muscle tissue embedding. Its slower polymerization rate enhances infiltration while maintaining optimal viscosity, making it a promising choice for TEM sample preparation, particularly for fragile biological specimens [4,5].
Image Ozaf048.423 figure 1
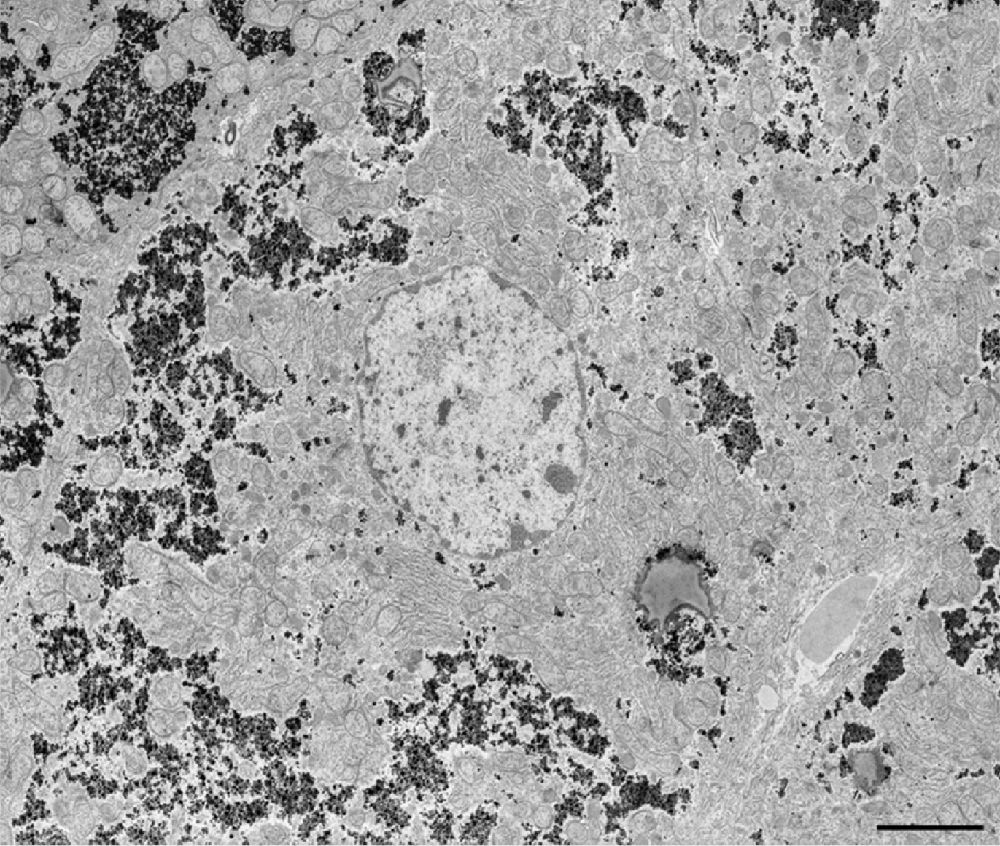
Fig. 1. Low magnification image of a representative field of the mouse liver. Scale bar = 4 um.
Image Ozaf048.423 figure 2
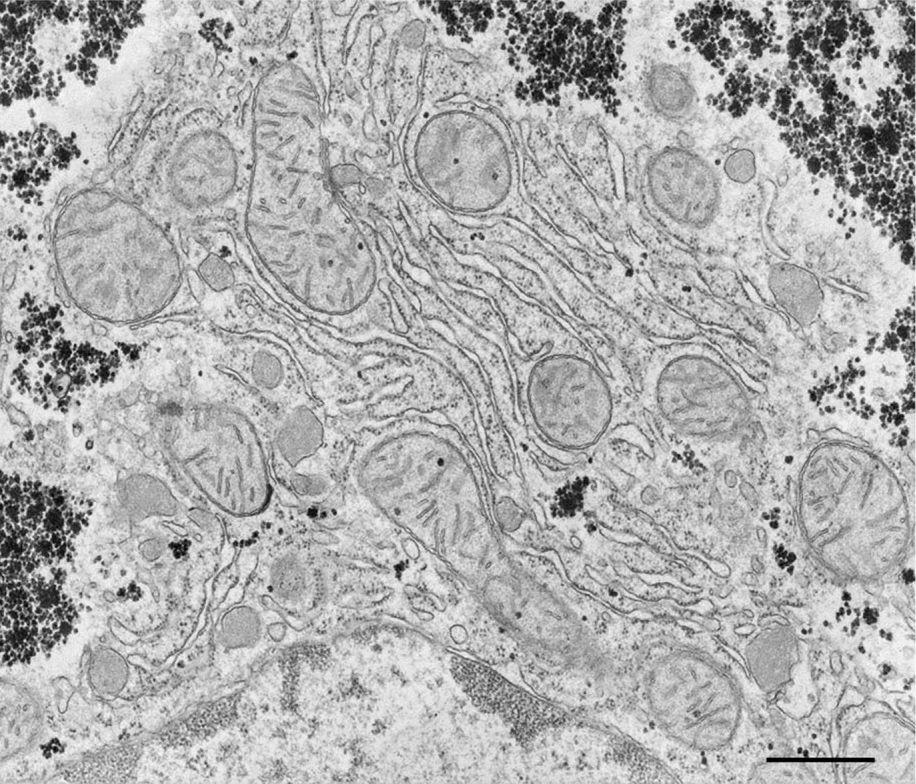
Fig. 2. Higher magnification image of mouse liver cell showing subcellular structures. Scale bar = 800 nm.
References
- Luft JH. Biophys. Biochem. Cytol. (1961) 9, 409.
- Spurr AR. Ultrastruct. Res. (1969) 26, 31.
- Glauert AM. Fixation, dehydration and embedding of biological. New York, NY: Elsevier North-Holland; 1975.
- The author acknowledges supports from the Penn State College of Medicine, Dr. H.G. Wang, and Dr. Ronggui Chen provide the mouse liver, heart, and skeletal muscle tissue.
- I declare that I have no personal or financial interest in Ledd Research and Tousimis and my findings in this paper are solely based on objective research.


